The other day I had the most
interesting conversation with a local Southampton accountant, who asked me
about my articles on the Southampton property market. It was quite humbling to
be given praise by such a professional, when he commented enthusiastically on
the articles I write. He was particularly interested in the graphs, facts and
figures contained within them, so much so that he recommends his clients read
them, as most of them are either Southampton homeowners, Southampton landlords or
oftentimes both. However, one question that kept me on my toes was, “With so many house price indices, how do you
know which one to use and how can you calculate what is exactly happening in Southampton?”.
To start with, there are indeed a
great number of these indices, including the Land Registry, Office of National
Stats, Halifax, Nationwide and LSL to name but a few. The
issue occurs when these different house price indices give diverse pictures of
the state of the UK housing market. Whilst some indices measure the average
value of every property in the UK (sold or unsold), others measure the average
‘price-paid’ of houses that happen to be sold over a fixed time scale… confusing
isn’t it!
A lot of the variance between
house price indices occurs because of the distinctive ways in which the numerous
indices endeavour to beat these issues. You see, the biggest problem in creating
a house price index, when comparing and contrasting with most other indexes, (e.g. inflation where the price is a
ubiquitous tin of Beans which can easily be measured over the months and years),
is that every home is unique. And as Southampton people are only moving every 13
years, it appears the only thing that can be measured is the price of property
sold in a given month.
By their very nature, all of the
indices are only able to paint a picture of the whole of the UK or, at best,
the regional housing market. As I have said many times in my articles on the Southampton
property market, it is important to look to the medium term when considering
house price inflation/deflation. When looking at the month-to-month jumps, many
indices look like one of those jumpy lie-detector needles you see in the cold
war movies!
I can guarantee you that in the
coming few months, on a month-by-month basis, one or more of the indices will
say that property prices will have dropped. Let me tell you, no property market
indices are representative of the housing market in the short term. Many
indices have shown a drop around the Christmas and New Year months, even during
the boom years of 2001 to 2007 and 2013 to 2015.
So, back to the question, how do
we work out what is happening in the Southampton Property Market and can there
be a Southampton House Price Index?
To calculate what I consider is a
fair and proper house price index for Southampton, I initially needed to decide
on a starting place for the index. I have chosen 2008 as far enough back, but
still giving us a medium/long term view. Next, I split all the house sales into
their types (Detached/Semi/House /Apartment) to give us an indication of what
is actually selling by postcode district. So, for example, below is a table for
the SO15 postcode district (the sample shows 2008, 2016 and 2017.
|
|
2008
|
2016
|
Proj 2017
|
|
Detached
|
7.8%
|
7.2%
|
6.9%
|
|
Semi Detached
|
31.3%
|
28.1%
|
25.2%
|
|
Terraced
|
25.3%
|
19.4%
|
23.5%
|
|
Apartment
|
35.6%
|
45.3%
|
44.4%
|
Then I look at the actual numbers
of properties sold in the SO15 postcode district. Below is the graph with the
numbers for the aforementioned years.
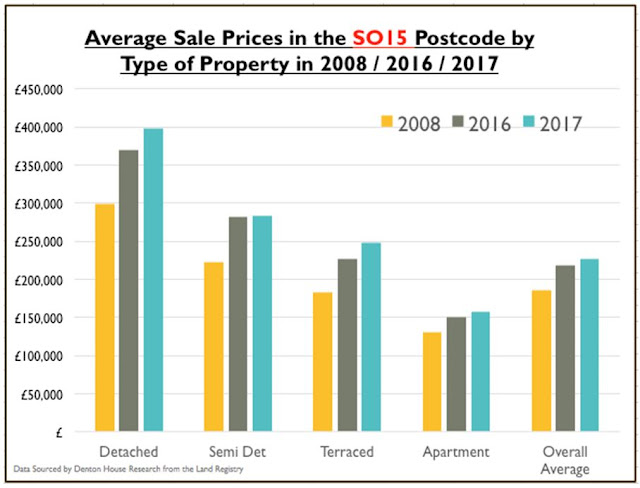
Next, I have looked at the prices
paid for the different property types during every year since 2008 again, in
this example, using the sample years of 2008, 2016 and 2017 for the SO15
postcode.
Finally, I amalgamated the same data
points for the other postcode districts covered by Southampton and the
surrounding villages, weighted it accordingly, to produce the Southampton House
Price Index ... which after all that work, currently stands at 145.63 for Q4 2017 (Q4 2008 = 100).
I hope you found that of interest.
Over the coming months and seasons I shall refer back to the Southampton House
Price Index within my Southampton Property Blog to
give you a flavour of what is really happening in the Southampton Property
Market
If you are looking for an agent that is well established, professional andcommunicative, then contact us to find out how we can get the best out of your investment property.
Email me on brian.linehan@belvoirlettings.com or call on 023 8001 8222.
Don't forget to visit the links below to view back dated deals and Southampton Property News.
Twitter, https://twitter.com/sotonbelvoir
LinkedIn, https://www.linkedin.com/in/brianlinehan
LinkedIn, https://www.linkedin.com/in/brianlinehan


Star Marketing Pvt Ltd is offering Best Property for Investment in Pakistan great locations great facilities at affordable prices, as Star Marketing Pvt Ltd
ReplyDeleteGreat webpage buddy, I am going to notify this to all my friends and contacts as well.
ReplyDeletenewfuturabycdl.sg
People who are looking for the best property in Lucknow, can buy from rssgreenland.co.in
ReplyDeleteReal Estate Developers in Lucknow Plots in Lucknow
Residential Properties in Lucknow
Residential Plots in Lucknow
Yoursz, a real estate property platform for global Chinese buyers, is committed to functioning as a bridge to connect global Chinese investors with one another.
ReplyDeleteForeigners Buying Real Estate In Us
Fine method of telling, and enjoyable article to acquire factual statements.
ReplyDeletestarklawpllc